One of the high points in the profession of a project manager is when he or she is the go-to person for the C-level executives in an organization. A typical project manager would have either been such a go-to person or would have seen others who are called upon by the senior management when in need.
A key capability that distinguishes a good project manager from others is “firefighting”, which refers to reviving projects that are in crisis mode. Project revival would typically involve analyzing the macro view of the project as well as the micro view.
In the macro view, the project manager who is firefighting would assess the overall project environment by asking the right questions and suggesting corrective actions. The micro aspect involves investigating specific areas of the project and this can be best done using statistical quality control tools and techniques. Three techniques – namely root cause analysis diagrams (also called RCA, Ishikawa diagrams, fishbone diagrams, cause-effect diagrams), Pareto charts, and weighted decision tables – are very useful in assessing troubled projects at a micro level and choosing the appropriate corrective actions. These 3 techniques are described below.
Read previous posts on recovering troubled projects below:
Troubleshooting Using the 3 Techniques
1. Root Cause Analysis
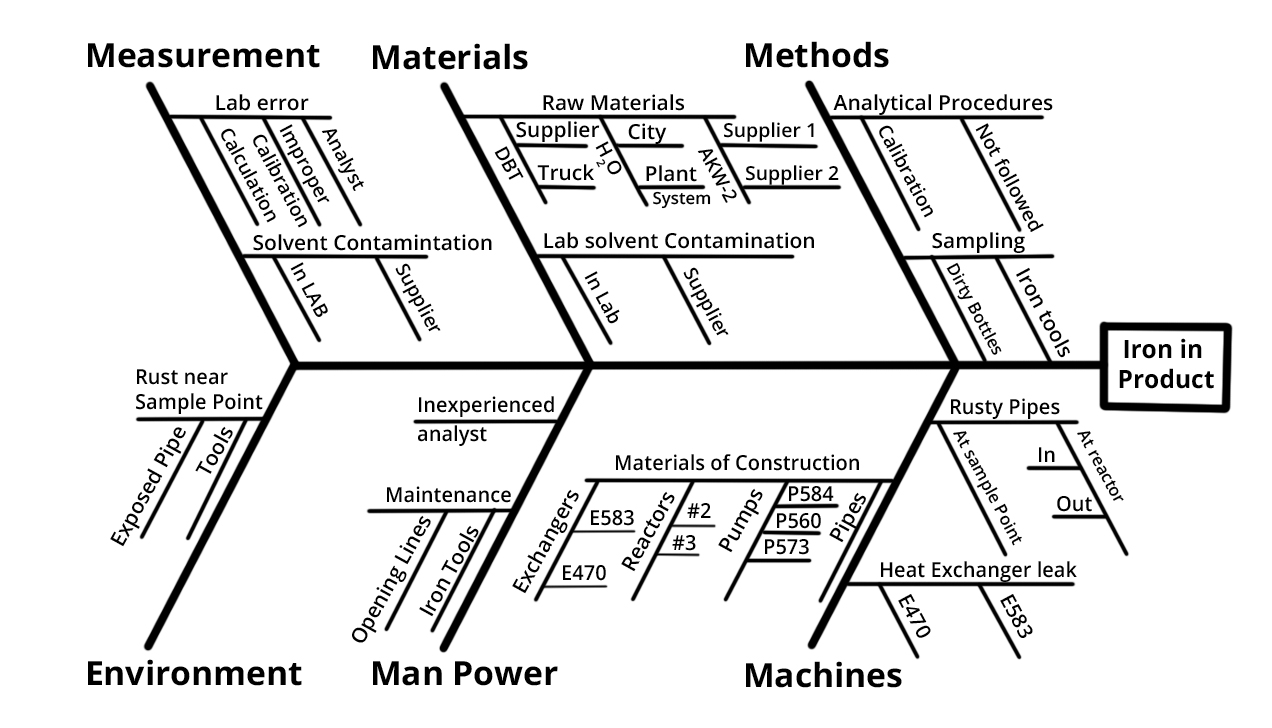
After examining the project environment, a project manager has to focus on specific areas of problems. The first step is to carry out a root cause analysis and list the causes contributing to the problem. The most well-known format of root cause analysis is an Ishikawa diagram, alternatively called a fishbone diagram or cause-effect diagram. This diagram list causes for an effect (a problem) under specific categories to identify the root cause. The categories can be flexible and can be decided by the people carrying out the root cause analysis. Typical categories used in the manufacturing segment are men, machinery, materials, and methods; sometimes measurements and management are also included. Categories developed for manufacturing industries can easily be adapted to other sectors as well.
The format of a typical Ishikawa diagram is illustrated below:

In this diagram, the main categories have been subdivided into subcategories that are only illustrative and not standard subcategories.
2. Pareto Charts
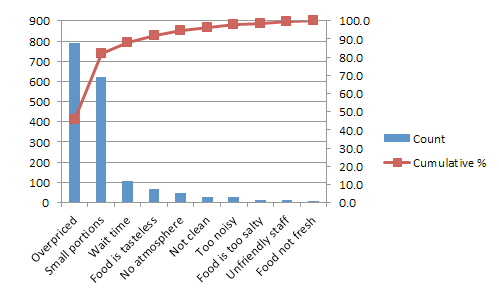
The identified root causes are then statistically analyzed to determine the frequency of occurrence of defects due to each cause and are plotted using Pareto charts. These charts are based on the Pareto principle, which is named after engineer, economist, and sociologist Vilfredo Federico Damaso Pareto who identified the ‘80 – 20 rule’. The 80 – 20 rule states that 80% of the results occur because of 20% causes. This rule has enormous applicability and the book ‘The 80 – 20 Principle’ is a great reference to understand this concept further.
A typical Pareto chart is illustrated below:

Please note that in diagram 2, 2 factors out of 10 (20%) are causing more than 80% of the complaints, and resolving these two factors would yield maximum results in reducing customer complaints.
3. Weighted Decision Table
After the top priority root causes are identified, corrective actions are brainstormed and listed. The corrective actions should eliminate the root causes, and bring the project back on track. In order to finalize the corrective actions, potential corrective actions are listed in a decision table and are assigned scores against evaluation factors. Each evaluation factor is assigned a score as well and a weight is assigned to each evaluation factor as shown in the table below
| Sl # | Corrective actions | Evaluation factor 1 | Weight | Evaluation factor 2 | Weight | Cumulative score |
| 1 | Action #1 | 5 | .4 | 6 | .5 | 5 |
| 2 | Action #2 | 8 | .4 | 6 | .5 | 6.2 |
| 3 | Action #3 | 6 | .4 | 5 | .5 | 4.9 |
The cumulative score can either be the sum of the weighted scores on individual evaluation factors or it can even be a product of the individual scores; this is left to the implementation team to decide.
A detailed example of using statistical tools to solve a hypothetical problem is explained here.
In summary, statistical quality control tools enable the reviving of troubled projects, especially in focusing on specific areas of the project. With an understanding of root cause analysis, Pareto charts, and weighted decision tables, project managers can bring a project back on the route to success.


