Implementing efficient project management methodologies is crucial in the current dynamic business environment characterized by rapid changes and demanding timelines. Among these methodologies, the Program Evaluation and Review Technique (PERT) is a sophisticated network diagram that facilitates meticulous business project task management.
This article will explain everything you need to know about PERT and how to utilize it effectively to get the greatest results. By delving into the practical intricacies of PERT, we aim to provide professionals with valuable insights on effectively integrating this methodology into their project management repertoire.
Table of Contents:
- What is PERT?
- What Does PERT Chart Contain?
- When to Use a PERT Chart?
- How Does a PERT Chart Work?
- How to Make a PERT Chart?
- PERT Chart Examples
- Advantages and Disadvantages of using PERT Charts in Project Management
- PERT Chart vs. Gantt Chart
- Conclusion
What is PERT?
Program Evaluation and Review Technique (PERT) is a project management methodology designed to assist in planning, scheduling, and coordinating tasks within a project. It aims to handle the complexities of large-scale projects, particularly those with uncertain durations and interdependencies.
At its core, PERT employs a network diagram visually representing the sequence and relationships among various project tasks. Each task is represented as a node, and arrows indicate the flow and dependencies between tasks.
PERT incorporates estimates for the time required to complete each task, considering both optimistic and pessimistic scenarios, and calculates a weighted average known as the expected time.
Key components of PERT include nodes (representing project milestones or events), arrows (indicating the flow and dependencies between tasks), and time estimates for each task, considering optimistic, most likely, and pessimistic scenarios.
The methodology incorporates a probabilistic approach to project scheduling, calculating the expected time for each task to account for uncertainties.
PERT charts provide a visual tool for project managers to plan, schedule, and coordinate tasks efficiently. They aid in identifying the critical path, optimizing resource allocation, and managing project risks.
PERT is particularly useful for projects with intricate task dependencies and variable durations, offering a systematic approach to project planning and execution.
What Does PERT Chart Contain?
A PERT chart contains visual representations of key project management elements to aid in planning and scheduling. The essential components include:
Nodes
- Symbolic representations of project events or milestones are often depicted as circles or rectangles
- Signify key points such as task initiation or completion
Arrows
- Connect nodes to illustrate task sequence and dependencies
- Depict the flow of activities in the project
Float or Slack
- Represents the flexibility for task delays without affecting project duration
- Critical path tasks have zero floats, indicating no room for delay
Critical Path
- The longest task sequence determining the minimum project duration
- Tasks on the critical path have zero float and are crucial for the project timeline
Lead Time
- Allows a successor task to start before the completion of its predecessor
- Facilitates schedule acceleration by overlapping tasks
Lag Time
- Intentional delay between a predecessor’s completion and its successor’s start
- Accounts for waiting periods or specific time gaps between tasks
Time Estimates (O, M, P)
- Optimistic (O), Most Likely (M), and Pessimistic (P) time estimates for each task
- Used to calculate the expected time and assess task duration probabilities
Predecessor and Successor Relationships
- Defines the order in which tasks must be executed
- Predecessors must be completed before successors can begin
A PERT chart is a comprehensive visual tool that allows project managers to understand task dependencies, identify critical paths, estimate project duration realistically, and manage project timelines effectively.
When to Use a PERT Chart?

-
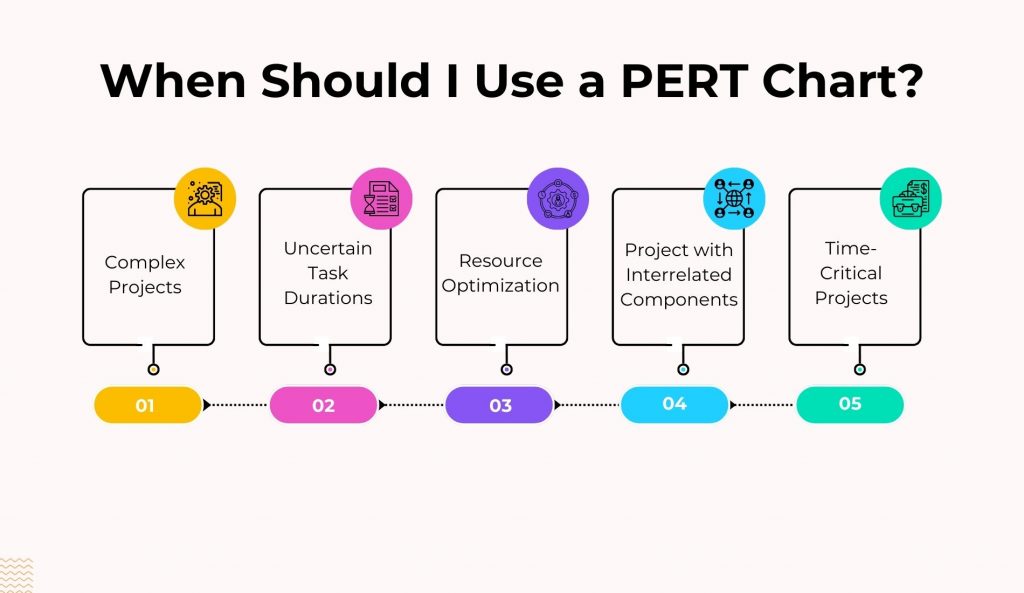
Complex Projects
PERT charts are particularly effective when dealing with complicated projects with many tasks and intricate interdependencies. The visual representation helps project managers and teams understand the project’s structure and complexities.
-
Uncertain Task Durations
PERT’s probabilistic approach proves invaluable when task durations are uncertain or variable. Incorporating optimistic, most likely, and pessimistic time estimates provides a more realistic view of project timelines, considering various scenarios.
-
Resource Optimization
When optimizing resource allocation is critical, PERT charts come into play. Identifying critical paths and tasks with zero floats allows for better resource utilization and prevents potential bottlenecks, contributing to overall project efficiency.
-
Project with Interrelated Components
PERT charts are well-suited for projects with interconnected components. By illustrating how changes or delays in one area impact the project timeline, they provide a comprehensive view that aids in strategic decision-making and risk management.
-
Time-Critical Projects
In projects with strict deadlines and time constraints, PERT is indispensable. Identifying critical paths and potential areas for optimization ensures efficient time management and enables proactive decision-making to meet project deadlines.
How Does a PERT Chart Work?
A Program Evaluation and Review Technique (PERT) chart works by visually representing the sequence of tasks, their dependencies, and the estimated time required for each task within a project.
It represents a project through a network diagram featuring numbered nodes connected by labeled vectors, with arrow directions indicating task sequences. When constructing a PERT chart, project managers should adhere to the following steps:
- Identify all project activities
- Consider task dependencies
- Create nodes and arrows based on the gathered information
- Determine the completion time for each task
After constructing the PERT chart, project managers can employ it to establish a realistic project timeframe:
- Identify the longest path based on entered estimations, encompassing tasks with the lengthiest durations
- Sum the completion times for each task to estimate the overall project duration
- Subsequently, use the PERT chart to adjust times in response to changing circumstances or to ensure project completion by the designated deadline
How to Make a PERT Chart?
Creating a PERT chart is a structured process crucial for visualizing project timelines, dependencies, and critical paths. This step-by-step guide outlines the key actions to construct a PERT chart efficiently, ensuring project managers can effectively plan, manage resources, and navigate the complexities of intricate project landscapes.
-
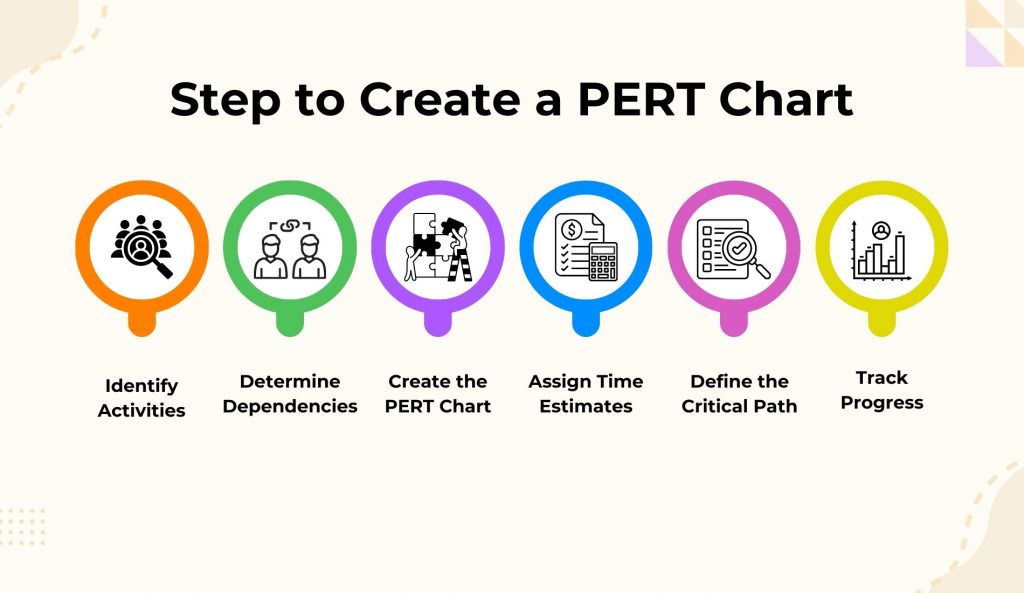
Identify Activities
Begin by identifying and listing all the activities or tasks involved in the project. These activities should be specific and clearly defined, encompassing the entire scope of the project.
-
Determine Dependencies
Establish the relationships and dependencies between the identified activities. Identify which tasks must be finished before others can start, ensuring a logical sequence for the project workflow.
-
Create the PERT Chart
Develop the visual representation of the project using a PERT chart. Draw nodes to represent each activity and connect them with arrows to indicate task sequences based on the determined dependencies.
-
Assign Time Estimates
Assign time estimates to each activity, considering three scenarios: optimistic time (O), most likely time (M), and pessimistic time (P). These estimates provide a range of possible durations for each task.
Project managers can use the PERT formula to determine work length based on various time estimations.
E = (O + (4 × M) + P) / 6
In this formula:
- Optimistic Time (O) is the best-case scenario for the time required to complete the activity
- Most Likely Time (M)Most Likely Time (M) is the most realistic estimate of the time required for task completion under normal conditions
- Pessimistic Time (P)Pessimistic Time (P) is the worst-case scenario for the time required to complete the activity
Let’s consider an example to illustrate the use of the PERT formula:
Suppose you have an activity with the following time estimates:
- Optimistic Time (O): 4 days
- Most Likely Time (M): 7 days
- Pessimistic Time (P): 10 days
Using the PERT formula:
E = (O + (4 × M) + P) / 6
E = (4 + (4 × 7) + 10) / 6
So, E = 7 Days
-
Define the Critical Path
Determine the critical path, which is the longest sequence of tasks determining the minimum project duration. Calculate the expected time for each activity and determine which tasks lie on this critical path. The critical path tasks have no float or slack.
-
Track Progress
Continuously monitor and track the progress of activities against the PERT chart. Update the chart as tasks are completed or if there are changes in project circumstances. This ongoing tracking ensures that the project stays on course and deviations can be addressed promptly.
PERT Chart Example
Now that you grasp the PERT chart steps, it’s time to create your own. Since diagrams vary based on project complexity and duration, yours may exhibit some differences. To initiate the process:
- Establish your numbered nodes: These represent the primary tasks that, upon completion, constitute the entire project. While your diagram can encompass any number of tasks, commencing with around ten is advisable.
- Establish connections between nodes and tasks: Utilize arrows to depict task dependencies, illustrating the necessary steps for event completion. Ensure your diagram has a clear starting point and conclusion, even if the middle section appears more intricate.
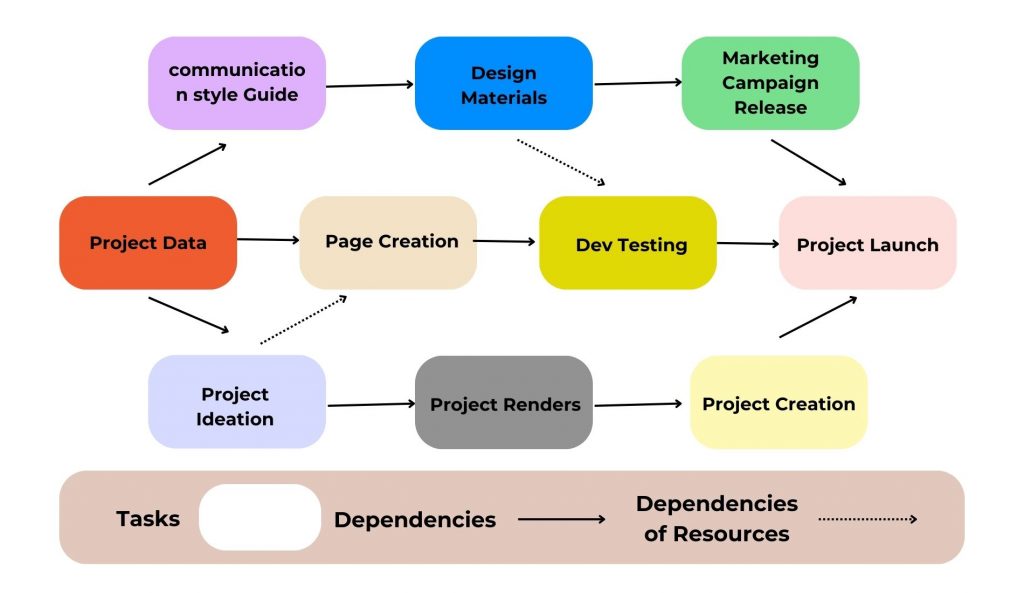
Here’s an illustrative example of how your PERT chart might take shape:
Here’s an overview of the key terms commonly employed in your PERT chart, along with their respective definitions:
- Nodes: Project events are represented by nodes. These are the major components that comprise your project. For instance, in a website design launch, a node could depict the creation of a new logo.
- Tasks: Tasks constitute the actions necessary for the implementation of nodes. As an illustration, a task might involve designing three logo mockups.
- Dependencies: Dependencies denote the connections between tasks, signifying interdependence. Tasks linked by dependencies rely on one another, with one task contingent on the completion of another.
- Dependencies without Resources: This term refers to a connection between tasks that lacks tangible subtasks. For example, while a product launch and a landing page may be correlated, no specific tasks are directly linked.
Creating PERT charts can be facilitated through various tools, including project management software. These tools assist in meticulous planning, visualization, and establishing task dependencies and reminders, enabling effective project tracking and bottleneck identification.
Advantages and Disadvantages of using PERT Chart in Project Management
Integrating PERT charts into project management practices can yield notable benefits, offering a visual roadmap to navigate project complexities. However, like any methodology, PERT charts come with inherent strengths and limitations. Below, we delve into the advantages, as well as the potential challenges that occur in PERT charts.
Advantages of Using PERT Chart in Project Management
The PERT charts in project management have numerous benefits. Some of the most effective ones are listed below.
- Visual Representation: PERT charts visually represent the project, making it simpler for project managers and team members to better understand its structure, dependencies, and critical paths
- Task Sequencing and Dependencies: PERT helps identify and sequence tasks, highlighting dependencies between them. This ensures a logical flow of activities and assists in efficient project planning
- Probability and Uncertainty Management: PERT incorporates time estimates that account for optimistic, most likely, and pessimistic scenarios. This probabilistic approach allows for better project scheduling management of uncertainties and risks
- Critical Path Analysis: PERT identifies the critical path, helping project managers focus on tasks directly impacting the project’s duration. This allows for effective resource allocation and prioritization of efforts
- Resource Optimization: By highlighting critical paths and non-critical tasks with float or slack, PERT aids in resource optimization. It enables project managers to allocate resources efficiently and identify areas for potential acceleration
Disadvantages of Using PERT Chart in Project Management
The disadvantages of the PERT charts in project management include the following:
- Complexity and Time-Consuming: Creating a PERT chart for large and complex projects can be time-consuming. The detailed analysis required to identify activities, dependencies, and time estimates may need to be more practical for smaller projects
- Assumption of Independence: PERT assumes that activities are independent, which may not always be the case in real-world projects. Dependencies and interactions between tasks may be more intricate than the linear relationships PERT assumes
- Limited Precision: The accuracy of PERT estimates depends on the quality of the input data and the precision of the time estimates provided. In some cases, the inherent subjectivity of time estimates may result in limited precision
- Overemphasis on Critical Path: While critical path analysis is a strength of PERT, it can lead to overemphasis on critical tasks, potentially neglecting the importance of non-critical tasks that contribute to overall project success
PERT Chart vs. Gantt Chart
Navigating project management often involves choosing between visualization tools such as PERT charts and Gantt charts. While both serve to streamline project planning, they differ in their visual representations, emphasis on task dependencies, and adaptability to project changes.
The below-curated comparison table aims to elucidate the distinctive features of PERT and Gantt charts, assisting project managers in selecting the most suitable tool for their specific project needs.
| Criteria | PERT Chart | Gantt Chart |
| Visualization | Depicts task dependencies using nodes and arrows | Presents tasks as horizontal bars on a timeline |
| Task Dependencies | Utilizes three-time estimates (O, M, P) for each task to calculate expected time | Typically, it shows only one duration estimate for each task |
| Critical Path | Identifies the critical path, emphasizing tasks crucial for project duration | Offers less emphasis on identifying the critical path |
| Resource Allocation | Aids in optimizing resource allocation by highlighting critical paths and slack time | Provides a basic overview of task timing but may not optimize resource allocation as effectively |
| Ease of Understanding | It may be more complex, requiring familiarity with the PERT methodology | Generally more straightforward and widely understood. |
| Flexibility and Updates | It may be less flexible for dynamic project changes; updates can be time-consuming | More adaptable to changes, allowing easier updates to reflect real-time project status. |
| Project Size | More suitable for large and complex projects with intricate dependencies | Effective for projects of varying sizes but particularly useful for simpler projects |
| Real-time Tracking | It may require careful manual updating for real-time tracking | Allows for relatively easier real-time tracking and updates |
Conclusion
PERT (Program Evaluation and Review Technique) emerges as a powerful asset in project management, offering a systematic approach to planning, scheduling, and navigating complexities.
Through our exploration, we’ve uncovered the intricacies of PERT, from its key components like nodes and critical paths to its practical application in optimizing resource allocation and managing uncertainties.
As a dynamic methodology, PERT empowers project managers to achieve precision in project execution. Embrace the insights shared in this blog to harness the full potential of PERT, ensuring your projects unfold with strategic efficiency and success.
Elevate your project management skills with Invensis Learning’s Project Management Certification Courses. Dive deeper into methodologies like PERT, gaining practical insights to enhance your project planning and execution. Enroll today to unlock a world of strategic project management excellence and confidently propel your career forward.


